This guide should help you in understanding the various poll report metrics and features in detail.
Freshmarketer generates reports instantly in sync with the responses collected for the poll. Follow this guide to know more about poll reports.
In general, irrespective of any question types, certain useful metrics are generated for every poll experiment.
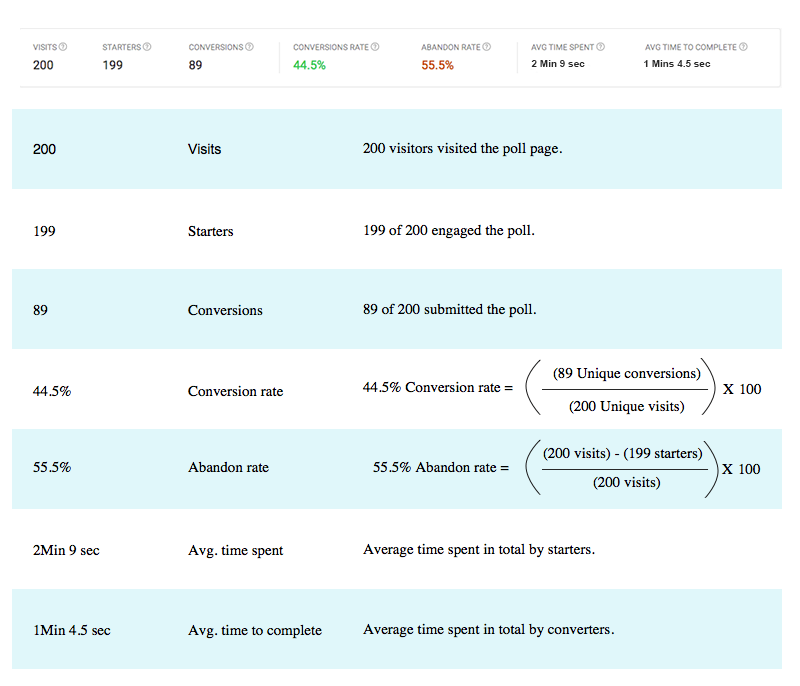
Visits- Number of visitors visiting the poll-contained web page. This metric explains how many people have actually seen the poll and is counted irrespective of whether or not interactions are made with the poll.
Starters- Number of users who have interacted with the poll out of the total visitors. Starters will actually give an insight on how many users were interested in responding the poll. Any engagement made with the poll widget, by a user is counted in starters. Until the cookie expires, starters value is maintained and is counted as one per visitor for actions such as clicks, taps and focus made on the poll.
Conversions- Number of interactors who have successfully submitted the poll. Conversions are tracked upon reaching the thank you message in poll, after a successful poll submit.
Conversion rate- Conversion rate represents the percentage of visitors who have submitted the poll. This is calculated by using the formula: (Conversions / Visits) * 100.
Abandon rate- Abandon rate represents the rate at which visitors leave the poll, interacting with it. Abandon rate is calculated by using the formula: ( (Visits - Starters) / Visits) ) * 100.
Avg. time spent- Time spent on an average by the total visitors for a particular poll and is calculated in terms of seconds. When a user engages with the poll again after moving away from the poll, the average time spent value is incremented to the already existing value.
Avg. time to complete- Time spent on an average by the visitor to submit the poll. Only converted users are considered in calculating this metric.
Let us consider an example in explaining the metrics of a poll report.
Polls Metrics
Poll Question Wise Metrics
Apart from the above-mentioned metrics, Freshmarketer generates metrics subjected to each poll question.
- Visits- No of visitors who have visited this poll question.
- Starters- No of interactors who have interacted with this poll question.
- Drop off- No of visitors who have left this poll question unanswered.
- Responses- No of responses collected for this poll question.
Types of Graph Generated In Poll
The following are the reports generated for poll, based on question types:
- Word cloud- Short and long answer question type.
- Bar chart- Radio button and checkbox question type.
- Gauge chart- Net Promoter Score (NPS) question type.
Word Cloud

Polls: Word Cloud
Word cloud graph is generated for short and long answer question type. Word cloud is generated from the responses collected. The word that has repeated at a maximum count will be displayed in a larger font. This will help you to focus on the opinion that has got more priority.
Bar Chart

Polls: Bar chart
The bar chart is generated for radio button and checkbox question type. This graph represents the percentage at which the option has been selected.
Gauge Chart

Polls: Gauge Chart
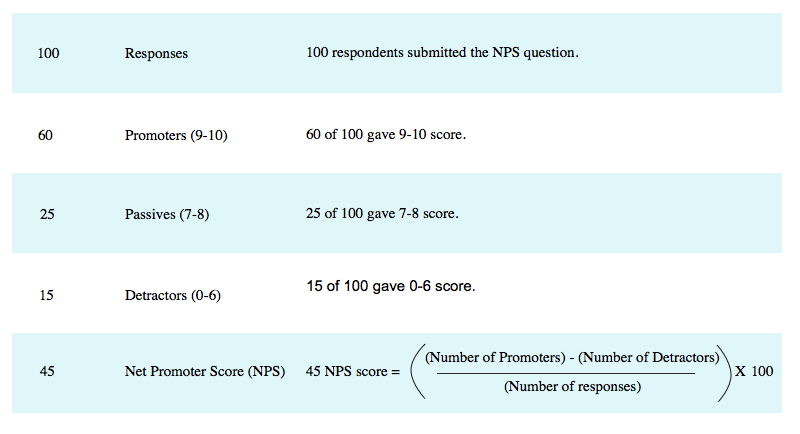
Gauge chart is generated for Net Promoter Score (NPS) question type. This graph represents the NPS score with the individual percentage of promoters, detractors, and passives. NPS score is calculated with the formula: NPS= (% of Promoters) - (% of Detractors) or NPS= ((Number of Promoters) - (Number of detractors)) / (Number of responses) * 100
Example:
Example Responses
NOTE: The NPS score can be negative and it ranges from -100 to +100.