This guide should help you in understanding the various form report metrics and features in detail
Freshmarketer’s form analytics provides super-intelligent, actionable insights that are interwoven with an online form
The following are the reports generated for every web form:
- Form trend report
- Drop-offs report
- Corrections report
- Average and hesitation time report
- Starters, refocus and corrections report
- Blank rate report
- Device engagement report
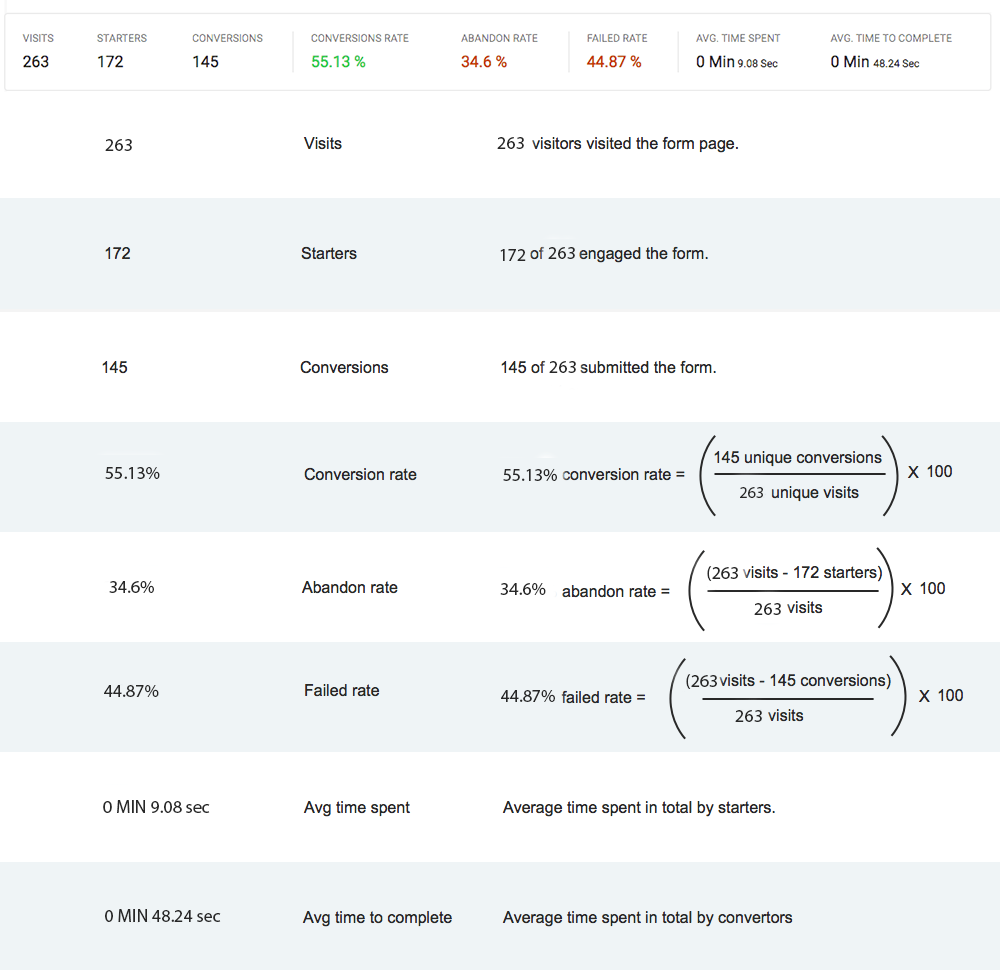
Form Trend Report
Starters - Number of users who have interacted with the form out of the total visitors. Starters will actually give an insight on how many users were interested in filling the form. Any engagement made with any of the form fields by a user are counted in starters. Until the cookie expires, starters value is maintained and is counted as one per visitor for actions such as clicks, taps and focus made to a field.
NOTE: For forms with an autofocus field, starters are not taken into account.
Conversion rate - Conversion rate represents the percentage of visitors who have submitted the form. This is calculated by using the formula: (Conversions / Visits) * 100.
Abandon rate - Abandon rate represents the rate at which visitors leave the form without interacting with it. Abandon rate is calculated by using the formula: ( (Visits - Starters) / Visits) ) * 100.
Failed rate - Failed rate represents the rate at which visitors have left (With and without interaction). This is an important metric as it tells you about interactors who had interest in filling the form
Avg. time spent - Time spent on an average by the total visitors for a particular form and is calculated in terms of seconds. When a user engages with the form after moving away from the form, the average time spent value is incremented to the already existing value.
Avg. time to complete - Time spent on an average by the visitor to submit the form. Only converted users are considered in calculating this metric.
Form Metrics
Drop-Offs Report
Corrections Report
Average Time and Hesitation Time Report
Avg time will tell you about how long visitors take in an average to fill the field. This value is incremented every time a user engages the field after a pause or jumping to some other field.
Hesitation time of a field represents the time between the focus and the time taken to type the first character in the field.
Starters, Refocus and Corrections Report
- Starters-Total number of visitors who have actively engaged with each of the form fields. This metric is calculated with much accuracy as autofocus and autofills are ignored in starters value calculation.
- Refocus-Total Number of revisits made for each form field. Refocused fields are calculated when a visitor taps or clicks the field again after engaging some other fields in the form. Refocus will denote that the user is trying to fill again because the user was unsure of the field.
- Corrections-Total Number of refills made in each form field.
Blank Rate Report
A field will be left blank when a user finds the information on the field as ambiguous or found it unwanted.
Device Specific Engagement Report
This cross-device report will help you get a better idea of how your form is performing for various devices and make decisions on enhancing the form for a particular device.
Features of Form Analytics Graph
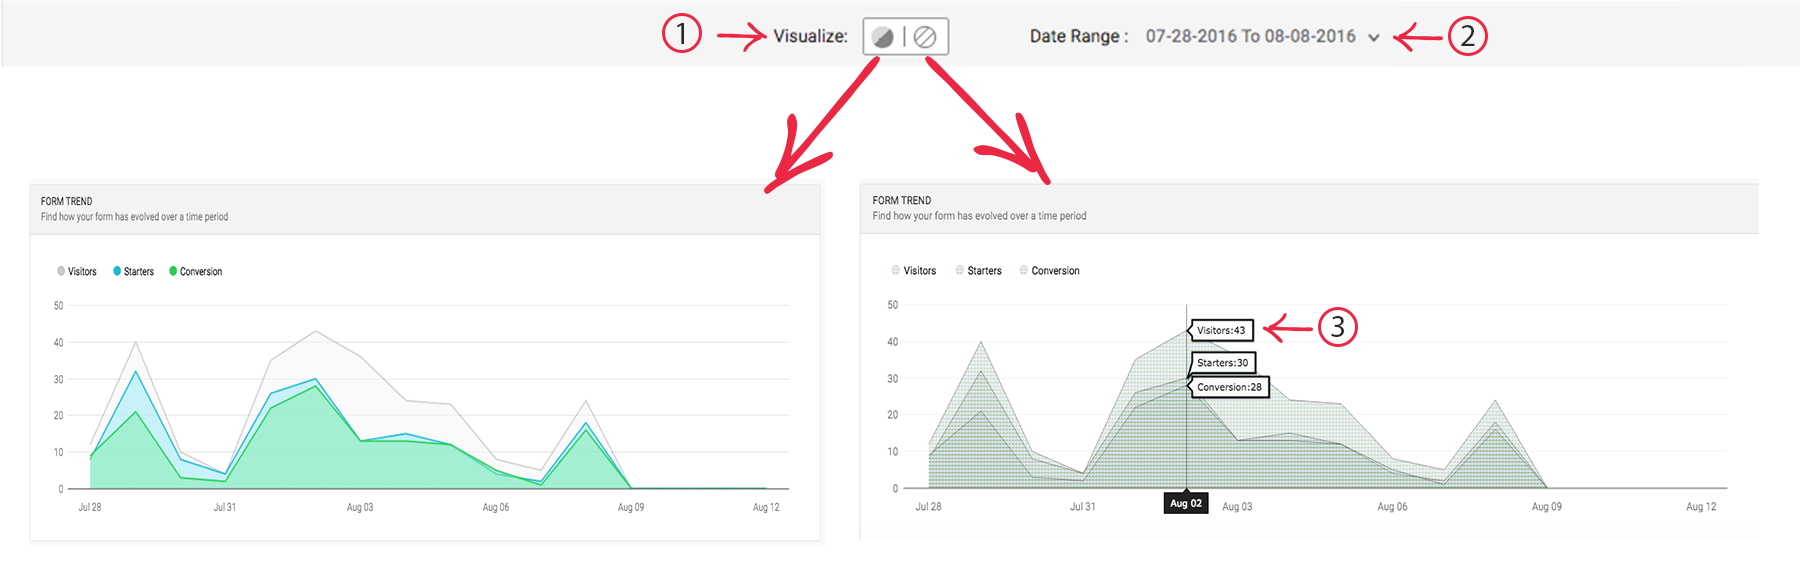
Form Analytics Graph
1. Visualize- Graph can be visualized in two ways: Colored and Line graph. Generate graphs instantly for the same data.
2. Date Range-View reports for the specified date or date range.
3. Annotations-Hover anywhere on the graph and get the data displayed.
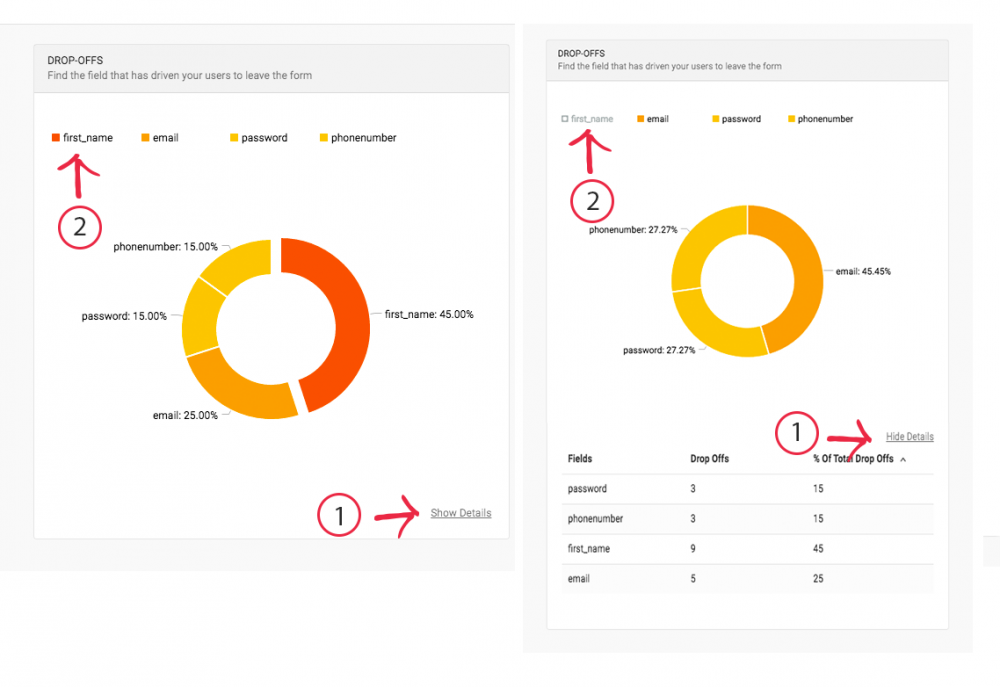
Form Drop-offs Chart
1.Field Metrics- View details of every report in a tabular form by clicking on Show Details link.
2.Filter Fields- This allows you to filter fields of the form and view reports only for the fields you wish to analyze.
For forms that have fields with browser autofill feature, Freshmarketer won’t be able to calculate the form metrics since the fields get filled automatically without any user interaction.
Technical Support