Freshmarketer provides you with the most useful tool in AB testing - the AB testing calculator which comes with three different options,
- Sample Size Calculator
- Duration Calculator
- Significance Calculator
Sample Size Calculator helps in calculating the number of visitors needed to arrive at a conclusion for the A/B testing experiment.
Duration Calculator facilitates in calculating maximum duration (days) for which the test should run for the specified sample size, to arrive at a proper decision.
Significance Calculator helps you in knowing if the test results are statistically significant.
Each of the above-mentioned calculators helps in calculating the parameters that will assist you in arriving at a suitable conclusion.
It is crucial to know the sample size for an experiment before arriving at a decision. This is mainly because when the test has a low conversion rate for a given sample size, it simply means that there is no real evidence to explain the conclusion accurately. In other words, the real cause of the difference between the baseline and variation cannot be proven evidently. It is subjective and can be due to many other reasons.
For this purpose, Freshmarketer provides a Sample Size Calculator with which you can determine the count of visitors required in the test to achieve conversions.
Freshmarketer’s Sample Size Calculator accepts three inputs namely,
- Baseline conversion rate
- Minimum Detectable Effect (MDE)
- Statistical significance
With the help of these input values, Freshmarketer calculates the Sample size per variation required to achieve the desired statistical goal. Freshmarketer employs a complex algorithm to arrive at the sample size numbers.
Let’s know in detail about the inputs needed to calculate Sample size per variation.
Baseline conversion rate
This is one among the three parameters used to determine sample size which defines the existing conversion rate of the test page. It is calculated using the formula,

Baseline Conversion Rate
Baseline Conversion Rate is represented in terms of percentage. It is usually measured using data from analytics platforms like Google Analytics.
Minimum Detectable Effect (MDE)
The Minimum Detectable Effect(MDE) represents the relative minimum increase over the baseline that you are willing to detect in the experiment. It is mainly helpful in prioritizing the experiments. Here, you'll need less traffic to detect high changes and more traffic to detect little changes. MDE can also be used as a standard parameter to measure how long a test should run (duration of the test).
Statistical significance
Statistical Significance is the probability that the conversion rate between the baseline(original) and a given variation is significant not based on some random action or choice. A result of an experiment is considered to be statistically significant if it is possibly not caused by chance for a given statistical significance level.
An experiment's statistical significance level indicates the risk tolerance and confidence level. For instance, an AB testing experiment with a significance level of 95% means that if a winner is determined, then it can be of 95% certainty that the observed results are real and not an error produced by randomness. In the end, it also signifies that there is a 5% chance that the calculation could be mistaken.
In Freshmarketer, the AB testing calculator has a standard statistical significance level of 95% as a default value. The ideal range is between 80 to 99.
Relationship between MDE, Baseline conversion rate and Sample Size per variation
To compute the sample size per variation for an experiment, the current baseline conversion rate and the minimum detectable effect(MDE) is required.
If the experiment measures an actual improvement at a level that is equal to or higher than the MDE, the significance will be met within the given sample size. In short, a significant result will be visible with equal or fewer visitors than formerly predicted. In this situation, a winning variation can be determined more quickly than anticipated. However, if the experiment detects improvement at a level which is lower than the MDE, the statistical significance will not be achieved within the given sample size, which implies that the test has to keep running to conclude the winning variation.
Example
For instance, let’s assume that an online fashion store owner is running an experiment for their site's product page. The baseline conversion rate is 20% and determines that the variation will improve the baseline by at least 10% and the variation conversion rate will be 22% or more. Hence, the MDE for this scenario should be 10%.

Sample Size Calculator
Using Freshmarketer's sample size calculator, he/she determines a sample size of 20,800 per variation. Since the experiment has two variations, an approximate of 41,600 visitors is needed to detect a change of 10% or more at a standard 95% statistical significance. Now, the experiment is launched and the data begins to pour in. There can be two possible cases.
- The actual conversion rate for the variation is higher than 22%. If this rate persists, it can be inferred that the significance will be achieved within 41,600 visitors.
- The conversion rate goes below 22% which signifies that the statistical significance will not be probably reached within 41,600 visitors. This also implies that the improvement is lower than the originally predicted 10%.
Now is the time to decide whether he/she should continue running the test or to settle with this and proceed with the next set of options for the test.
In sample size calculator, observe how the baseline conversion rate and MDE directly affect the sample size. The smaller the baseline is, the larger the sample size required to detect the same relative change (MDE). The table given below explains the difference in sample size per variation for different baseline conversion rate and a fixed MDE and statistical significance.
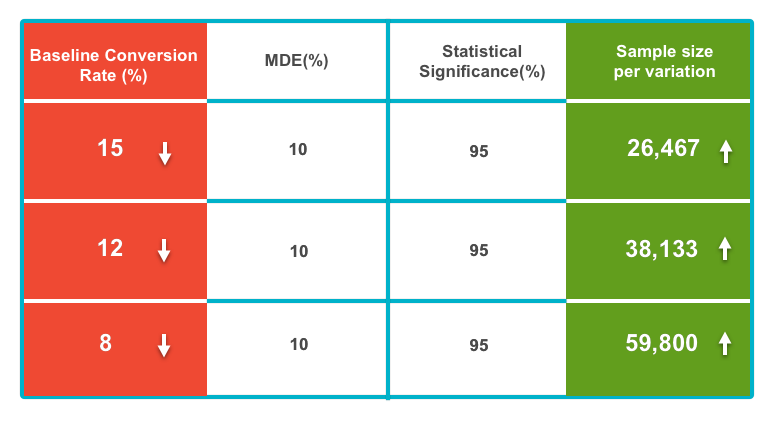
Baseline Conversion Rate Vs Sample size per variation
Now that the sample size has been calculated, you can determine the duration of the test you want to run. For this purpose, Freshmarketer provides you with the Duration Calculator.
Freshmarketer’s Duration Calculator takes 6 different inputs and carefully assess those numbers to yield the approximate span of test to reach the desired outcome.
Out of the 6 inputs that this calculator takes, 3 inputs relate to sample size per variation calculation. Hence, you can calculate the duration of the test with the help of 4 parameters namely,
- Sample size per variation,
- Number of variations,
- Average number of daily visitors
- Percentage of Visitors included in test
In the previously stated example with 20800 as the 'sample size per variation', the remaining 3 inputs should be given in order to calculate the test duration. Let’s assume
- Number of variations = 2
- Average number of daily visitors = 200
- Percentage of Visitors included in test(%) = 100
- Sample size per variation = 20,800
○ Because, Baseline conversion rate(%) = 20
○ Minimum Detectable Effect (%) = 10
○ Statistical Significance (%) = 95

Duration Calculator
Here, Freshmarketer assesses these numbers and suggests the Number of days required as 104 days to achieve the desired result.
Relationship among the parameters of the Duration Calculator
In the duration calculator, each of the parameters is vital in calculating the duration. First, the “number of variations” plays an important role because to arrive at a conclusion for a test comprising of more variations, you will have to wait for more time than for a test comprising of fewer variations. This is explained by the table given below,
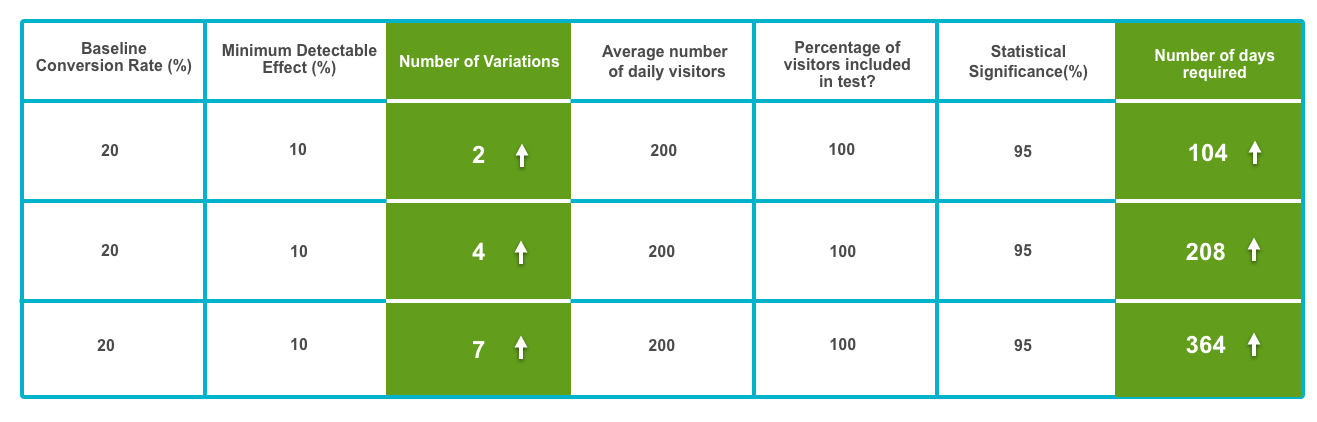
Number Variation Vs Number of days required
From the table, you can see that the number of days required increases with respect to the rise in the number of variations. This is because when there are many variations, then all those variations have to be tested for the visitors visiting your site. The test with more number of variations will take more time in deciding the winning variation.
Now, increasing the “Average number of daily visitors” will reduce the test duration while keeping other parameters at constant. For instance, look at the table below.
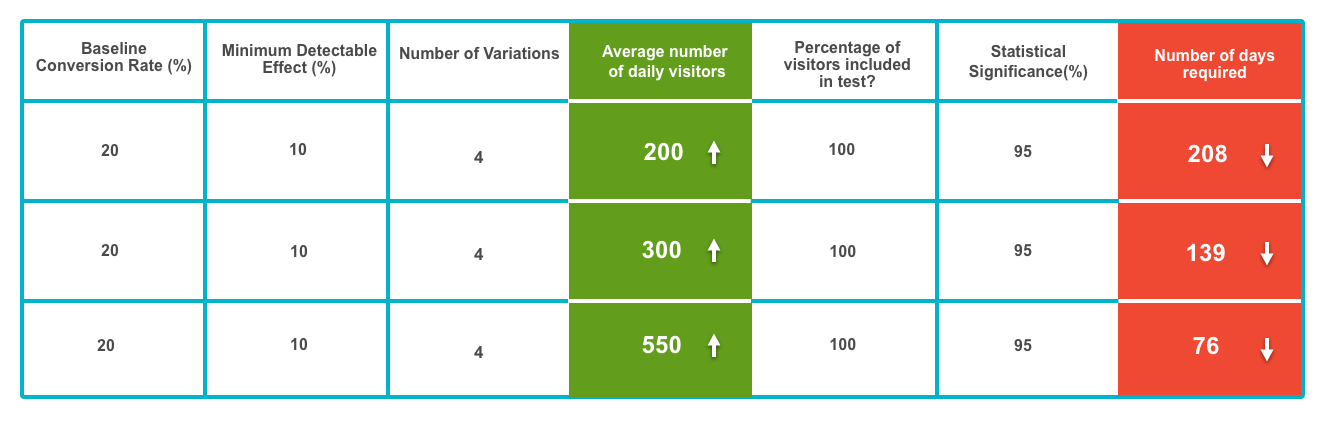
Average number of daily visitors Vs Number of days required
This is because when the traffic in your site is high, then the variations can be tested quickly in a short interval. Thus, the duration of the test will be less for the test with higher visitor traffic.
For the “Percentage of visitors to be included in test?” parameter, the test duration will be less if more visitors are included. This can be explained with the help of the table given below.
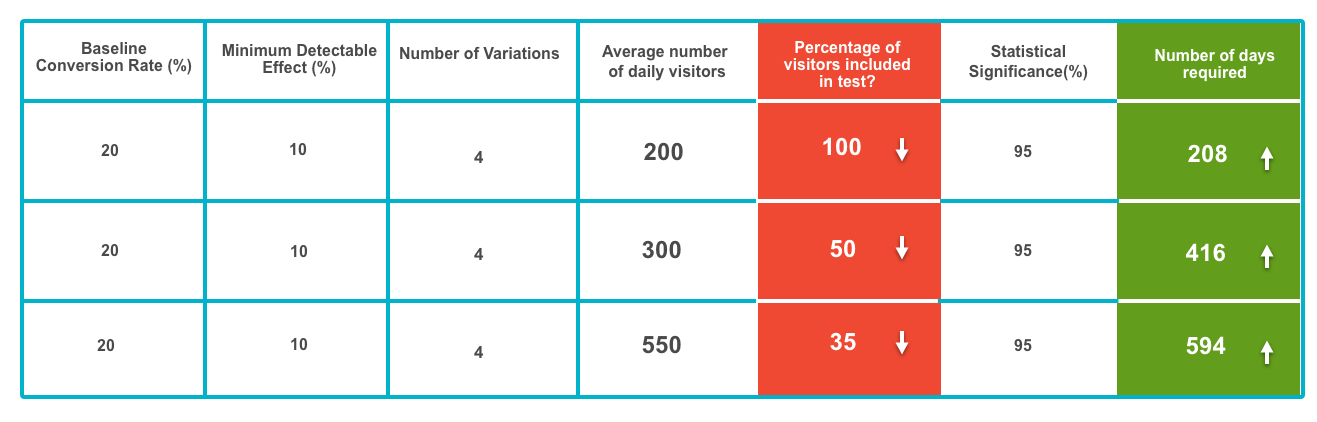
Percentage of visitors to be included in test Vs Number of days required
This increase in the test duration is mainly because when the visitor traffic is restricted, the variation has to be tested more extensively so that the winning variation can be declared.
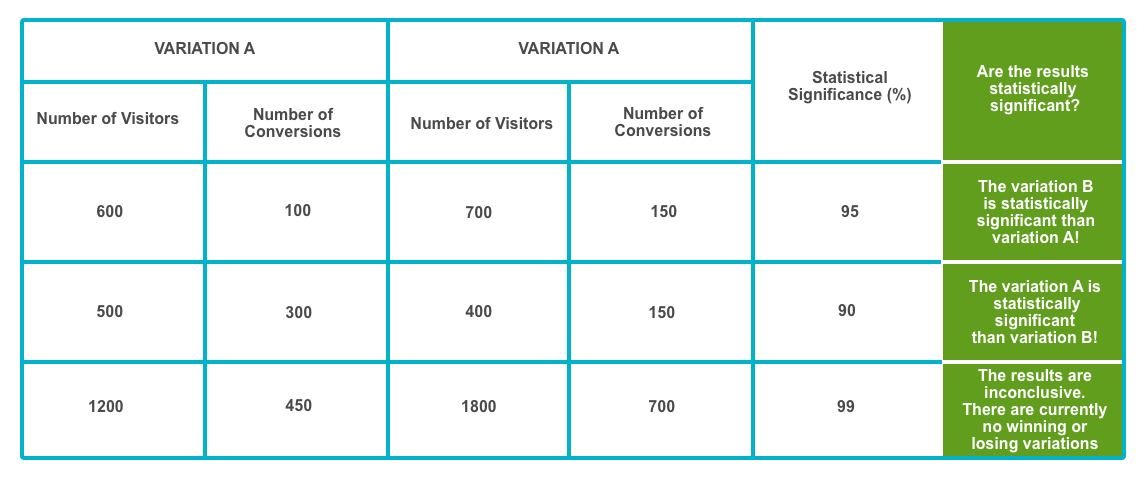
Significance Calculator
Freshmarketer provides a calculator which will determine if the result of a variation is statistically significant when compared with another variation. This significance calculator lets you compare two variations by providing two inputs namely,
- Number of visitors - Total number of unique visitors included in the A/B testing experiment.
- Number of conversions - Total conversions achieved in the A/B testing.
With the help of these two inputs(for each variation individually) and statistical significance value, Freshmarketer evaluates and declares a statistically significant variation among the two with the help of the algorithm which it employs. If Freshmarketer can’t arrive at a conclusion from the inputs, it will then display the result as “The results are inconclusive. There are currently no winning or losing variations.”

Significance Calculator
This calculator is particularly useful when you have two variations and you are confused to choose the statistically significant winning variation between those two.
Significance Calculator Example